Deagreez/iStock via Getty Images
2022 is a great example of how it’s always and forever a market of stocks, not a stock market.
YCharts
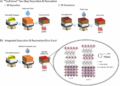
While rising rates and the Fed tightening have caused the market to sell off modestly and tech to fall into a correction, value is having a great year.
Daily Shot
That’s what generally happens when the Fed starts to tighten because current cash flows become relatively more valuable than future cash flows.
- all else being equal, the faster a company grows, the more sensitive its valuation is to interest rates
Does this mean that investors should sell all growth stocks and pile 100% into deep value high-yield blue-chips?
No, because historical market data only tells us what MIGHT happen, not what’s going to happen.
But in case 2022 does turn out to be the year value roared, and deep value Ultra SWANs soared, let me highlight why British American Tobacco (BTI) and Magellan Midstream (MMP) might be two of the best high-yield blue-chips you can buy today.
In fact, if these high-yield Ultra SWANs were to grow as expected this year and return to fair value in 2022, they could deliver 50% total returns or more.
Momentum funds and ETFs rebalance on a quarterly or bi-quarterly basis.
- so if the value rally continues, these funds might start selling tech and buying value
- driving an epic great rotation that could make 2022 the year value investors have been dreaming of
How To Find Blue-Chips With The Highest Fundamentally Justified Upside Potential
DK Research Terminal
We have 12 specialty watchlists in the Dividend Kings Research Terminal, for any kind of investing style, risk profile, or time horizon.
Let me show you how to quickly and easily find the blue-chips with the most upside potential in the short term.
DK Research Terminal
- green = potentially good buy or better
- blue = potentially reasonable buy
- yellow = hold
- red = potential trim/sell
The Phoenix list was started in the pandemic, targeting the highest quality companies in the world.
- most likely to rise like a Phoenix from the ashes of the recession to soar to new heights
It’s basically an almost 100% blue-chip watchlist of the world’s highest quality companies.
And you can sort any of our watchlists by 16 fundamentals including yield, discount to fair value, various quality metrics, as well as short and long-term total return potential.
- 12-month consensus total return potential: analyst 12-month consensus price target + dividend
- 12-month fundamentally justified total return potential: 12-month forward fair value + dividend (total return if a company grows as expected and returns to fair value)
- long-term consensus return potential: yield + long-term growth consensus
Once you sort by return potential, you can select for any fundamental you want, such as highest yield.
And that’s how you can find, in just seconds, red hot high-yield Ultra SWANs like BTI and MMP that have become Wall Street darlings, and for good reason.
British American Tobacco: Up 41% And Set To Soar So Much More
Full Deep Dive (Including Complete Risk Profile)
YCharts
Can you believe that BTI is beating tech by 50% since December 1st? That’s because BTI on December 1st, 2021 was trading at the best valuations in over 20 years!
Portfolio Visualizer Premium
That’s also what happened during the tech crash when BTI was similarly undervalued and then went on to deliver sensational returns during the market’s lost decade.
- 68% in 2000 vs -9% for the S&P 500
Rule number one: most things will prove to be cyclical. Rule number two: some of the greatest opportunities for gain and loss come when other people forget rule number one.” – Howard Marks (emphasis original)
BTI Total Returns 2000 To 2010 (Last Decade For Stocks)
Portfolio Visualizer Premium
During the last decade, BTI delivered 13X returns while the market went nowhere.
Portfolio Visualizer Premium
Adjusted for inflation, BTI investors saw 900% total returns, while S&P investors lost 20%.
Portfolio Visualizer Premium
In fact, when you buy an Ultra SWAN aristocrat like BTI at the best valuation in two decades, you can achieve Buffett-like returns from a blue-chip bargain hiding in plain sight.
Not just for a few years, but for decades.
- 25% CAGR for 15 years = 2742% or 28X returns
Why am I still bullish and buying BTI today, after an epic 41% gain in just 9 weeks?
Reasons To Potentially Buy BTI
- Very safe 6.3% yield (83% safety score)
- 83% low-risk 13/13 Ultra SWAN quality global aristocrat
- 23-year dividend growth streak (at least)
- 34% historically undervalued (potentially very strong buy) even after a 41% rally!
- Fair value: $70.51
- 9.7X earnings vs 13.5 to 14.5 historical
- BBB+ stable credit rating = 5% 30-year bankruptcy risk
- Risk management consensus 82nd industry percentile = very good
- 4% to 11% CAGR margin-of-error growth consensus range
- 8.7% CAGR median growth consensus (up from 4% a few months ago)
- 5-year consensus total return potential range: 15% to 20% CAGR
- 5-year consensus total return potential (base case): 18% CAGR
- 12-month total return consensus: 20%
- Fundamentally justified 12-month total returns: 58%
| Investment Strategy | Yield | LT Consensus Growth | LT Consensus Total Return Potential | Long-Term Risk-Adjusted Expected Return |
Long-Term Inflation And Risk-Adjusted Expected Returns |
| British American Tobacco | 6.3% | 8.7% | 15.0% | 10.5% | 8.3% |
| Safe Midstream + Growth | 3.3% | 8.5% | 11.8% | 8.3% | 6.0% |
| REITs | 3.0% | 7.0% | 9.9% | 6.9% | 4.7% |
| High-Yield | 2.7% | 11.3% | 14.0% | 9.8% | 7.5% |
| Dividend Aristocrats | 2.2% | 8.9% | 11.1% | 7.8% | 5.5% |
| Value | 2.1% | 12.1% | 14.1% | 9.9% | 7.7% |
| 10-Year US Treasury | 2.0% | 0.0% | 2.0% | 1.4% | -0.8% |
| 60/40 Retirement Portfolio | 1.9% | 5.1% | 7.0% | 4.9% | 2.7% |
| REITs + Growth | 1.8% | 8.9% | 10.6% | 7.4% | 5.2% |
| High-Yield + Growth | 1.7% | 11.0% | 12.7% | 8.9% | 6.6% |
| Dividend Growth | 1.6% | 12.6% | 14.2% | 9.9% | 7.7% |
| S&P 500 | 1.5% | 8.5% | 10.0% | 7.0% | 4.8% |
| Nasdaq (Growth) | 0.7% | 10.7% | 11.4% | 8.0% | 5.7% |
(Source: Morningstar, FactSet, YCharts)
BTI still offers a very safe 6.3% yield that analysts expect to now grow at almost 9% over time (4X the expected rate of inflation).
It’s also now expected to beat the S&P, aristocrats, Nasdaq, and pretty much every major investing strategy on Wall Street.
- 15.0% CAGR long-term returns are on par with the greatest investors in history
- just as John Templeton’s 15.6%
BTI 2023 Consensus Total Return Potential
FAST Graphs, FactSet Research
BTI achieving fair value by 2023 could deliver 33% annualized total returns over the next two years. FAST Graphs, FactSet Research BTI’s new stronger growth outlook means that even after a monster run, it’s still potentially set to deliver 18% annual returns over the next five years. Now compare BTI’s incredible total return potential to the S&P 500. FAST Graphs, FactSet Research Analysts expect the S&P 500 to deliver potentially -8% total returns over the next two years. Inflation And Risk-Adjusted Expected Returns (Source: DK S&P 500 Valuation And Total Return Tool) updated weekly Adjusted for inflation, the risk-expected returns of the S&P 500 are about 2% for the next five years. Can you see why I’ve been so bullish on BTI for over two years? This is the power of anti-bubble blue-chip investing. This is how long-term income investors can feel like stock market geniuses over the long term. This isn’t luck, it’s not magic, it’s pure fundamental analysis and disciplined financial science. DK DK Automated Investment Decision Tool For anyone comfortable with its risk profile, BTI still represents one of the most reasonable and prudent deep-value global aristocrats you can buy today.
BTI 2027 Consensus Total Return Potential

S&P 500 2023 Consensus Total Return Potential

Year
Upside Potential By End of That Year
Consensus CAGR Return Potential By End of That Year
Probability-Weighted Return (Annualized)
2027
36.54%
6.43%
4.82%
1.98%
BTI Investment Decision Score


One that has 60% fundamentally justified total return potential left…in 2022 alone!
Magellan Midstream (Uses K1 Tax Form): The Highest Yielding Blue-Chip On Wall Street
Full Deep Dive (Including Complete Risk Profile)
YCharts
MMP is up 6% since early December, beating the Nasdaq by an impressive 17%. Yet its rally could be just getting started.
Earnings Update
Magellan Reports Good Q4 Results; Continues to Be Among Midstream Leaders in Unit Repurchases…
Magellan’s fourth-quarter results were solid, as the partnership continued to benefit from a recovery in refined product volumes off depressed 2020 levels…
The core refined products business is projected to do a bit better than we expected, with 4% higher product shipments, and a 6% tariff increase, no doubt due to inflationary pressures…
Magellan continues to be among the more aggressive purchasers of its own units at prices below our fair value estimate, demonstrating management’s Exemplary capital allocation rating.
The partnership added another $50 million in purchases during the fourth quarter, bringing the total 2021 buyback to $523 million, and $800 million since inception…we would expect the incremental cash to be spent on further buybacks, so the cash will be put to good use.” – Morningstar
Reasons To Potentially Buy MMP
- Very safe 8.7% yield (85% safety score)
- 83% low-risk 13/13 Ultra SWAN quality dividend champion
- 20-year dividend growth streak
- 35% historically undervalued (potentially Ultra Value buy)
- Fair value: $72.97
- 8.8X cash flow vs 11.5 to 14 historical
- BBB+ stable credit rating = 5% 30-year bankruptcy risk
- Risk management consensus 70th industry percentile = good
- 2% to 7% CAGR margin-of-error growth consensus range
- 2.3% CAGR median growth consensus (down from 5.6% pre-earnings)
- 5-year consensus total return potential range: 13% to 20% CAGR
- 5-year consensus total return potential (base case): 14% CAGR
- 12-month total return consensus: 20%
- Fundamentally justified 12-month total returns: 62%
| Investment Strategy | Yield | LT Consensus Growth | LT Consensus Total Return Potential | Long-Term Risk-Adjusted Expected Return |
Long-Term Inflation And Risk-Adjusted Expected Returns |
| Magellan Midstream (K1 Tax Form) | 8.7% | 2.3% | 11.0% | 7.7% | 5.5% |
| Safe Midstream + Growth | 3.3% | 8.5% | 11.8% | 8.3% | 6.0% |
| REITs | 3.0% | 7.0% | 9.9% | 6.9% | 4.7% |
| High-Yield | 2.7% | 11.3% | 14.0% | 9.8% | 7.5% |
| Dividend Aristocrats | 2.2% | 8.9% | 11.1% | 7.8% | 5.5% |
| Value | 2.1% | 12.1% | 14.1% | 9.9% | 7.7% |
| 10-Year US Treasury | 2.0% | 0.0% | 2.0% | 1.4% | -0.8% |
| 60/40 Retirement Portfolio | 1.9% | 5.1% | 7.0% | 4.9% | 2.7% |
| REITs + Growth | 1.8% | 8.9% | 10.6% | 7.4% | 5.2% |
| High-Yield + Growth | 1.7% | 11.0% | 12.7% | 8.9% | 6.6% |
| Dividend Growth | 1.6% | 12.6% | 14.2% | 9.9% | 7.7% |
| S&P 500 | 1.5% | 8.5% | 10.0% | 7.0% | 4.8% |
| Nasdaq (Growth) | 0.7% | 10.7% | 11.4% | 8.0% | 5.7% |
(Source: Morningstar, FactSet, YCharts)
MMP’s growth outlook has fallen after earnings, but it’s still offering the highest blue-chip yield on Wall Street and is still expected to beat the S&P 500 over time.
MMP 2023 Consensus Total Return Potential
FAST Graphs, FactSet Research
Over the next two years, MMP growing as expected and returning to historical fair value (100% midstream bear market average P/OCF) could deliver 29% annualized total returns.
FAST Graphs, FactSet Research MMP growing at the low end of its growth consensus range and trading at the low end of its historical midstream fair value range could deliver 14% annual total returns or 115%. DK Automated Investment Decision Tool For anyone comfortable with its risk profile, MMP is still one of the best high-yield blue-chips you can buy today. It’s been a fantastic start to the year for value, with BTI and MMP climbing or even roaring higher while the market and tech struggles. I can’t promise you this will continue, though history and Fed tightening are on the side of the value investor in 2022, 2023, and 2024. What I can tell you is these Ultra SWAN ultra-yielders are still bargains and set to soar so much more in the coming years. If the value rotation holds until July, then momentum funds will start selling tech and buying value, and that could be just the catalyst for an epic 2022 rally. If BTI and MMP were to return to fair value this year, that would be 48% to 62% rallies from here. More importantly, you can lock in a very safe 6.3% to 8.7% yield today as well as potentially 11% to 15% long-term total returns. This combination of very safe yield and strong returns isn’t magic, it’s the stuff rich retirement dreams are made of. If you’re tired of worrying about retirement, then consider these high-yield Ultra SWAN coiled springs. If you’re sick of losing sleep over the market’s “crazy” short-term swings, it’s time to embrace long-term fundamental investing. If you’re frustrated by praying for luck on Wall Street, it’s time to start making your own luck. Luck is what happens when preparation meets opportunity.” – Roman Philosopher Seneca the Younger When you embrace disciplined financial science, you focus on safety and quality first, and prudent valuation and sound risk-management always. In other words, you stop gambling and start investing in your future. And with enough time, THIS is how you can retire rich, and stay rich in retirement, no matter what interest rates, the economy, or the stock market does.MMP 2023 Consensus Total Return Potential

MMP Investment Decision Score

Bottom Line: These Red Hot High-Yield Blue-Chips Are Set To Soar So Much More