
da-kuk/E+ via Getty Images
This article was first released to Systematic Income subscribers and free trials on Jan. 16.
Welcome to another installment of our CEF Market Weekly Review where we discuss CEF market activity from both the bottom-up – highlighting individual fund news and events – as well as top-down – providing an overview of the broader market. We also try to provide some historical context as well as the relevant themes that look to be driving markets or that investors ought to be mindful of.
This update covers the period through the second week of January. Be sure to check out our other weekly updates covering the BDC as well as the preferreds / baby bond markets for perspectives across the broader income space.
Market Action
Most CEF sectors were down on the week. Among the three income “spaces” of BDCs, preferreds / baby bonds and CEFs that we cover, CEFs were the laggards this week though not by much.
This week highlighted another important dynamic worth keeping in mind for CEF investors – the procyclicality of CEF discounts. In other words, when CEF NAVs rally, discounts tend to rally as well (i.e., tighten). And when CEF NAVs fall, discounts tend to fall as well (i.e., widen). This doesn’t work day in and day out but it’s obvious from longer-term trends.
We can see this in the weekly CEF sector performance chart below – the green area highlights sectors that saw flat or higher NAVs and in these sectors discounts rallied as well. The red rectangle highlights sectors that saw lower NAVs along with weaker / wider discounts. Sectors in between these two were mixed.
Systematic Income
On a year-to-date basis, most CEF sectors remain lower – under pressure from the combination of lower Treasuries and stocks.
Systematic Income
Fixed-income and equity sector median discounts are trading right on top of each other. Fixed income sector discounts have widened quite a bit off their tights near zero while equity sector discounts are quite strong, trading at a post-GFC record tight level. This dynamic jibes with broader sentiment of a relatively weak outlook for fixed-income sectors while the consensus for equity markets remains upbeat.
Systematic Income
Rising rates are top of mind for investors. The chart below shows the top CEF performers by total NAV returns since 3-Dec-21 when the 10-year Treasury yield marked a recent low of 1.35% – it is now at 1.78%.
The best-performing funds are primarily MLPs – a sector which has been in an uptrend last year due to the cyclical recovery as well as the spillover of high inflation. The rest are a mixed bag of equity funds, including covered calls, individual sector and international funds.
Systematic Income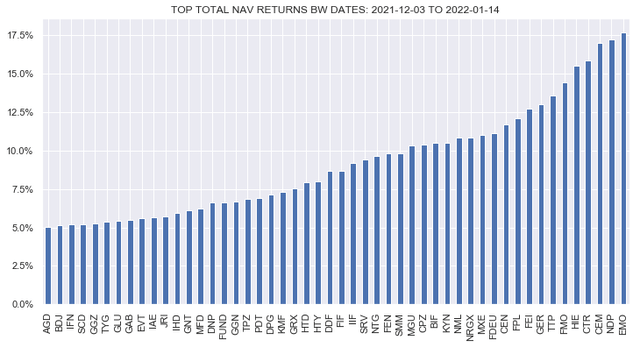
The worst performers include some Tech and Health-focused funds, longer-duration / higher-quality funds such as taxable and tax-exempt muni and investment-grade sectors as well as convertible funds which tend to have a Tech focus.
Systematic Income
If we limit our focus to fixed-income funds we see that the best performers have a floating-rate or multi-sector flavor. We have been highlighting a number of these funds recently such as the Western Asset Diversified Income Fund (WDI), the Ares Dynamic Credit Allocation Fund (ARDC), the Barings Global Short Duration High Yield Fund (BGH), the Apollo Tactical Income Fund (AIF) and others. We continue to hold many of these funds in our Income Portfolios.
Systematic Income
Market Themes
This week we wanted to highlight, what we call, a myopic CEF investment style – a misguided allocation strategy that glosses over some of the most important factors in CEF investing and misses the bigger picture.
Generally speaking, the process of CEF allocation goes like this:
- Is this a sensible sector to invest in?
- Is the CEF the right wrapper to use when allocating to this sector?
- Does this CEF have attractive features (e.g. alpha, discount, NII etc).
Very often we see investors (and analysts) skipping right to the last point and allocating largely based discounts and yields while ignoring the first two questions. Let’s go through three quick examples that we have found recently in the commentariat.
The first interesting case is the Western Asset Inflation-Linked Opportunities & Income Fund (WIW). WIW primarily holds TIPS and has a 4.47% distribution rate. On the face of it a fund that offers a mid single-digit yield, inflation protection on top and very little credit risk (the fund holds some corporate bonds apart from its majority TIPS allocation) looks like a slam dunk.
The trouble here is that many investors fail to come to grips with the mechanics of TIPS. The fund’s largest allocation at 11.4% is the 3.875% 15-Apr-2029 bond. It is no coincidence that this bond features an unusually high coupon, having been issued around 2000 during a brief inflation spike – TIPS issued more recently have a coupon of just 0.125%. The bond’s unusually high coupon (it is the highest coupon of all the fund’s TIPS holdings) pushes up the fund’s net income at the expense of future pull-to-par. However, it’s yield is very similar to what it would be for a bond with a 0.125% coupon of the same maturity.
Pull-to-par works a bit differently for TIPS because the face amount is adjusted by inflation, whereas for nominal bonds it is fixed for the life of the bond. The fund’s market value position in the bond is $144.9m but the face amount is just $102.3m. To provide some intuition here if inflation is zero to the end of the bond’s maturity in 2029, its market value will drop from $144.9 to $102.3, delivering a return of -1.21% (i.e. current its real yield). Of course, no one expects inflation to be zero. However, even if inflation is 4%, the bond will still lose about 6% of its value or have a drag of about 0.9% per annum on the fund’s NAV. The market is currently pricing inflation to average about 2.64% through 2029 which will deliver a 14.7% market value drop in the bond to maturity or about a 2.2% per annum drag on the NAV.
The key point here is that this pull-to-par drag is, in a sense, invisible in the fund’s income and coverage profile so investors who allocate on this basis of are missing a huge likely headwind for the fund in the coming years. The only way for this drag to disappear is for inflation to average about 5% through the maturity of the bond. That’s not impossible but it’s close to 2x what the market is pricing in.
The other thing to note is that the bond has a real yield of -1.21% which is not unusual for TIPS as real yields are negative across the entire TIPS yield curve. What this means is that the bond, if held to maturity, will deliver a performance of inflation minus 1.21%. So, the common refrain that TIPS offer inflation protection isn’t really true since it will lag inflation (or CPI-U, more specifically) by 1.21% per annum.
The key point here is that the fund’s large overweight in a TIPS with an unusually high coupon (the fund holds other higher-coupons TIPS as well in lower amounts) means that its distribution and coverage numbers significantly overstate its actual underlying yield.
The second case is the First Trust Specialty Finance & Financial Opportunities Fund (FGB) which appears attractive at an 8.2% discount and an 8% distribution rate.
The pitch for the fund goes as follows:
- Yes, long-term returns are bad but that’s only because of the GFC and recent returns have been great,
- The discount is very wide – much wider than the broader CEF market which is around a 2% average discount
- Yield is high at 8% and largely covered
- There is the usual positive discount on discount dynamic for funds of funds.
All of these reasons are problematic. First, the fund’s top 3 holdings are trading at premiums of 144%, 183% and 113% so the discount on discount thing is not real.
Second, the 8% FGB yield is actually 1.5% below the average yield in the BDC sector (including specials) so yes FGB has a high yield for the CEF sector but it’s actually low for the BDC sector which is what the fund holds and this is despite the fact that the fund has leverage.
Third, the fund’s discount may be wide relative to its own history but it’s not wide relative to its fair value. Back of the envelope, a fund that earns 8-10% on its portfolio and charges 1% for doing so should trade at a discount that’s actually wider than 8%.
Finally, the fund’s return is horrible even outside of the GFC e.g. 1.7% NAV CAGR in the last 5Y and 5.5% in the last 3Y. Our service BDC Tool shows the BDC sector has generated an average 3Y and 5Y CAGR of 9.9% and 9.7%.
Systematic Income BDC Tool
This mostly has to do with another issue which absolutely has to be addressed with CEFs which is that using leverage on highly volatile assets such as BDCs means the fund will tend to lock in permanent losses on sharp drawdowns. This is pretty much what keeps happening with FGB. For investors who want fund exposure in BDCs, holding ETFs makes a lot more sense than FGB as the following chart shows.
Systematic Income
The key takeaway here is that investors should come to grips with the fact that FGB has delivered performance that is miles away from what its underlying holdings have delivered. At the very least, investors in the fund (as well as analysts who pitch the fund) should have a view of why its terrible historic underperformance should be any different from what it has delivered in the past.
Finally, we will touch on the First Trust New Opportunities MLP & Energy Fund (FPL). The pitch for this fund is that 1) it is trading at a wide discount – around 12% at the start of the year which has since tightened to about 8% and 2) it is a conservative MLP fund with a 7.4% yield.
The first thing to say about MLP CEFs is that investors shouldn’t consider them income investments, something we discussed in an earlier article. This is because whatever income the sector throws off is totally swamped by the price volatility of the sector.
Another key point here is that the income stream in the sector is totally unreliable. Even a “conservative” fund like FPL has seen its distribution cut by two-thirds since 2018. At the start of 2018 the fund was trading around a 10.5% yield which surely looks even more attractive than the current 7.4% yield. However, investors who bought then are now holding a fund that is delivering them a 3.75% yield on their cost basis.
The “conservative” stance of FPL means it has delivered a -4.3% 5Y total NAV CAGR versus a -6.6% one for the sector. Not only is -4.3% per annum an obviously sad number but despite its “conservative” stance, the fund is also hugely underperforming the benchmark as the chart below makes clear.
Systematic Income
Maybe there are conservative ways of swimming with sharks but maybe the focus should be on the swimming with sharks rather than doing it in a conservative way. Losing an arm is better than losing your head when it comes down to it but neither one is all that appealing.
Ultimately, if there is one lesson that the CEF market has delivered over the last 3-5 years is that leverage and very volatile assets don’t mix. Many investors take the view that CEF price volatility doesn’t matter and some think that, actually, the lower the price goes the better since it allows them to buy more shares at lower prices. This misses the bigger picture – it is precisely the price volatility of the sector that explains why MLP CEFs have delivered a -6.6% 5Y total NAV CAGR and the unleveraged passive index fund AMJ delivered a -2% total NAV CAGR.
Ultimately, what is very weird is when analysts pitch MLP CEFs is that they don’t bother dealing with the gorilla in the room which is that the sector has lost half its capital (including dividends) in the last 5-7 years and fail to deal with the question why the future should be any different from the past.
The key takeaway here is that investors who find a CEF that looks attractive on discount and yield grounds should also consider whether its underlying sector exposure is worth holding and whether that sector exposure is better held in other ways such as open-end funds or as individual underlying allocations.
Market Commentary
Eagle Point released December NAVs for the Eagle Point Credit Co (ECC) and the Eagle Point Income Co (EIC). ECC NAV is down 1.5% in December and EIC is down 1.3% while both are down about 5% since their peaks a few months ago though some of that is due to recent special dividends. The CEF Tool shows the two funds are still trading at premiums – EIC at around 3% and ECC at around 6%.
Systematic Income CEF Tool
The premium of EIC in particular has deflated somewhat from its recent double-digit level and is no longer obviously expensive.
Systematic Income CEF Tool
With 4 hikes in 2022 now becoming consensus this should give EIC a decent boost since, unlike loans, CLO Mezz tranches have no Libor floors. This means the income of EIC will immediately reflect rises in short-term rates whereas the income of CEF loan funds will lag. Plus, the fact that a big chunk of EIC liability is fixed with the issuance of its preferred, its liabilities will not increase in cost as the Fed begins to hike. By contrast, the broader loan CEF sector, whose liabilities are nearly all floating-rate, will see its leverage costs rise. We continue to hold EIC in our High Income Portfolio.
A few distribution cuts came through from three Clough CEFs: the Global Equity Fund (GLQ), Global Opportunities Fund (GLO) and the Global Dividend and Income Fund (GLV) – the last two of these are Hybrid sector funds while the first is an Equity sector fund.
All three funds have a managed distribution policy that is set to 10% of their NAV for the last 5 trading days of the year. What’s odd about these funds is that they managed to deliver a negative total NAV return over the past year despite the obvious fact that equities did well in 2021. This also means they had a drop in NAVs over 2021 which drove the recent cuts due to the MDPs. As we discussed in an earlier article, funds with MDPs, particularly formulaic ones such as these three funds, don’t surprise investors when their distributions change. They can also allow investors to preposition for upcoming distribution cuts or raises. We highlight funds with MDPs in our CEF Tool on the service.
The Western Asset Global Corporate Defined Opportunity Fund (GDO) released its shareholder report covering the period up to October. The fund remains in the Defensive and Core portfolios due to its decent quality (about half in investment-grade bonds) and term structure which provides a discount anchor and a potential tailwind return into the termination. Recall that Western Asset funds don’t have a consistent history of terminating their term funds with (DMO) being a good example. Arguably, DMO was a special case because it used to trade at a premium anyway which would have allowed holders to exit not just at the NAV but above it. This could have been the reason for the managers to keep the fund from terminating. In any case, GDO net investment income profile trend looks good – NII increased to $1.07 in 2021 from $1.03 in 2020 (and from $0.99 in 2019). Coverage is still on the low side at around 88% but that’s not unexpected for the fund’s quality and NAV distribution rate of 6.94% (7.14% distribution rate on price). The discount is at around 3%. Duration is relatively low for a higher-quality credit fund at around 6. Treasury yields have moved up this year so it’s worth waiting for them to consolidate before adding to longer-duration funds in our view.
Based on some of the comments we received from readers, there is a sense that PIMCO taxable funds are getting decimated in the current period of rising Treasury yields. The reality is not quite as stark. On a year-to-date basis, the taxable funds are indeed lower but, outside of the agency-focused (RCS), the average return is around -0.75% in total which is not all that bad.
Systematic Income
More broadly, all of the PIMCO taxable funds are still up since the start of the second half of 2021, despite the 10-year Treasury yields having risen 0.33% in that span.
Systematic Income CEF Tool
It’s worth keeping in mind that the durations of the PIMCO taxable funds have shortened to around 3 from about 6 so the impact of higher rates is going to be fairly contained unless it also spills over into wider credit spreads.
Stance And Takeaways
In the CEF space our focus remains on higher-yielding credit, floating-rate and multi-sector funds that can benefit from or, at the very least, remain relatively resilient if interest rates continue their march upward. We have previously reduced our duration exposure a few months ago in favor of funds that could handle a rising rate regime relatively well. An example in our High Income Portfolio is the switch in August from GDO to AIF, which has delivered about a 10% return differential since then.
Systematic Income
We would look to add duration back in the portfolio if the 10-year Treasury moves north of 2% and consolidates there as well as rotate back into a higher-quality allocation as the cycle matures.
More broadly, a few funds that are worth a look are the Nuveen Mortgage and Income Fund (JLS) – a higher-quality MBS/ABS fund with a duration of 3.3 (6.9% discount, 4.85% distribution rate, about 75-80% covered). We also like the BNY Mellon High Yield Strategies Fund (DHF) – a HY corporate fund (4.6% discount, 7.16% distribution rate) as well as the Tri-Continental Corp (TY) – a hybrid allocation fund whose low distribution rate of 3.7% is a key driver of its wider discount. The reality is that the fund earns about the same as other hybrid funds, it’s just that it distributes a lot closer to what it actually earns. Its historic return is one of the highest in the sector.
Systematic Income CEF Tool
The fund’s discount has tended to trade wide of the sector, despite its superior returns and low fee. TY has now moved out to trade about 10% wider of the Hybrid sector average which looks like an attractive entry point for investors with a constructive view on equities.
Systematic Income CEF Tool