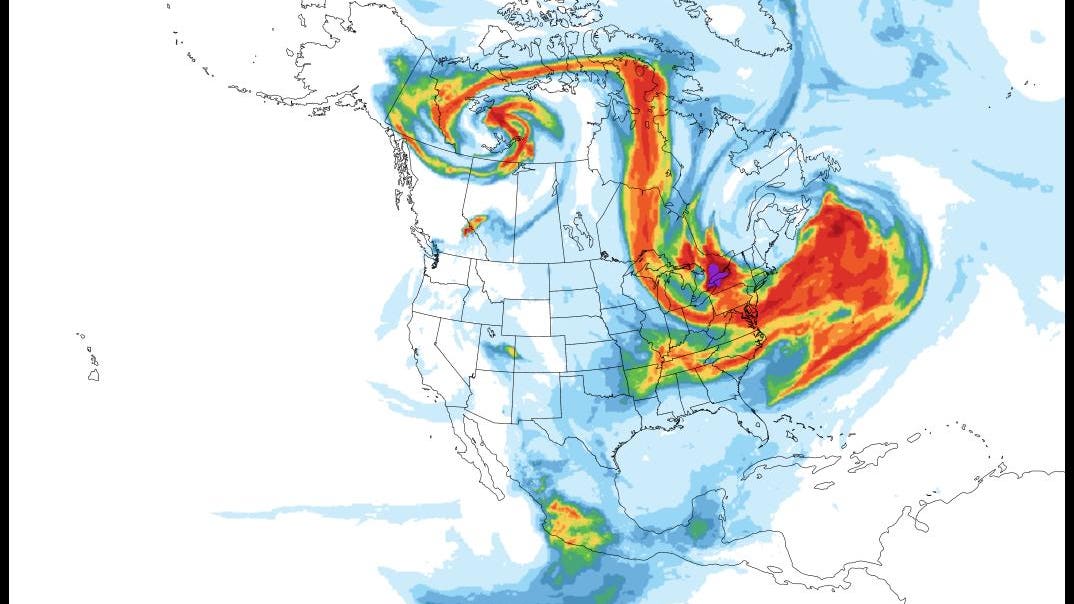
Smoke forecasts for June 7th, 2023
I was on a conference call earlier this morning. One of my colleagues in the Northeast had to take a moment to gather herself. She was being affected by poor air quality associated with smoke. At the time of writing, wildfires in Canada and prevailing winds were transporting a significant amount of smoke into the Interstate 95 corridor of the northeastern United States. That region includes densely populated cities like Washington, D.C., Baltimore, Philadelphia, and Boston. However urban dwellers are not the only communities highly vulnerable to poor air quality. Rural towns are also at risk. So what’s going on?
Let’s begin with the National Weather Service discussion from the Weather Prediction Center. On the morning of June 6th, they wrote, “Wildfire smoke moving southward out of Canada and over the northern part of the country has triggered Air Quality Alerts over parts of the Upper Great Lakes to the Northeast.” The map above is a model forecast of what vertically integrated smoke distributions are expected on June 7th.
Wind speeds and Geopotential Height at 500 mb.
As a meteorologist, it is interesting to look at why the smoke is streaming into the U.S. I will start with some weather basics. While we live at the surface. However, a deep dive into the smoke invasion requires us to look at the middle of the atmosphere. The map above shows the atmospheric flow at the 500 mb level. For the non-meteorologist reading this article, that simply means all of the height levels where the atmospheric pressure is 500 mb. In warmer air, that height is typically higher in altitude than in colder air. The map also shows atmospheric flow patterns and wind speeds. Of note, an upper level cyclone is apparent in the Northeast. The flow around the center of that cyclone is counterclockwise. Therefore, winds on the western side of the cyclone are blowing from the north and relatively strong too. This pattern explains why the Canadian smoke is being blown into the Northeast.
The “so what” of this atmospheric setup is that air quality alerts are in place for much of the Northeast. The U.S. Environmental Protection Agency (EPA) has developed an Air Quality Index (AQI). The EPA website says, “Think of the AQI as a yardstick that runs from 0 to 500….higher the AQI value, the greater the level of air pollution and the greater the health concern.”
At the time of writing, the AQI in parts of New York City (map below) were in unhealthy ranges for sensitive groups. In some parts of the region, the AQI was in the “red” zone, which indicates broader unhealthy conditions. According to the EPA, the following groups are particularly vulnerable to poor air quality:
- children
- pregnant women
- older adults
- low socioeconomic neighborhoods
- people with pre-existing heart and lung disease.
Communities of color have also shown a disproportionate sensitivity to poor air quality.
Unfortunately, the smoke will be in the region for much of the week before shifting weather patterns clear the air.
Select Air Quality Index values in the New York City area on the morning of June 6th, 2023.
Discover more from Today Headline
Subscribe to get the latest posts to your email.


