-
Table of Contents
- Introduction
- What are the Applications of Decision Tree Regression in Real-World Problems?
- How to Automate the Process of Building Decision Tree Regression Models?
- What are the Different Ensemble Methods for Decision Tree Regression?
- How to Evaluate the Performance of Decision Tree Regression Models?
- What are the Different Pruning Techniques for Decision Tree Regression?
- How to Visualize Decision Tree Regression Models?
- What are the Best Practices for Building Decision Tree Regression Models?
- How to Handle Missing Values in Decision Tree Regression?
- What are the Different Types of Decision Tree Regression?
- How to Avoid Overfitting in Decision Tree Regression?
- How to Choose the Best Splitting Criterion for Decision Tree Regression?
- What are the Limitations of Decision Tree Regression?
- What are the Benefits of Decision Tree Regression?
- How to Interpret the Results of Decision Tree Regression?
- What is Decision Tree Regression and How Does it Work?
- Conclusion
“Unlock the Power of Machine Learning with Decision Tree Regression: An Easy and Intuitive Way to Get Started!”
Introduction
Decision Tree Regression is a powerful machine learning technique that can be used to make predictions and decisions based on data. It is an intuitive approach that is easy to understand and implement, making it a great choice for machine learning beginners. Decision Tree Regression works by creating a tree-like structure of decisions and outcomes, which can be used to make predictions and decisions based on the data. The tree is built by splitting the data into smaller and smaller subsets, and then using a measure of impurity to determine which subset is the best to split on. The process is repeated until all the data is split into the most pure subsets possible. The resulting tree can then be used to make predictions and decisions based on the data.
What are the Applications of Decision Tree Regression in Real-World Problems?
Decision tree regression is a powerful machine learning technique that can be used to solve a variety of real-world problems. It is a supervised learning algorithm that can be used to predict a continuous target variable based on a set of independent variables. Decision tree regression is a non-parametric method that can be used to model complex relationships between variables.
One of the most common applications of decision tree regression is in the field of finance. It can be used to predict stock prices, forecast currency exchange rates, and identify trends in the stock market. It can also be used to identify potential investment opportunities and to assess the risk associated with a particular investment.
Decision tree regression can also be used in the field of healthcare. It can be used to predict the likelihood of a patient developing a particular disease or condition based on their medical history and other factors. It can also be used to identify potential treatments for a particular condition and to assess the effectiveness of a particular treatment.
Decision tree regression can also be used in the field of marketing. It can be used to identify customer segments and to predict customer behavior. It can also be used to identify potential marketing strategies and to assess the effectiveness of a particular marketing campaign.
Finally, decision tree regression can be used in the field of engineering. It can be used to identify potential design solutions and to assess the performance of a particular design. It can also be used to identify potential failure points in a design and to assess the risk associated with a particular design.
How to Automate the Process of Building Decision Tree Regression Models?
Decision tree regression models are powerful tools for predicting outcomes based on a set of input variables. Automating the process of building these models can save time and resources, and improve the accuracy of the results. Here are some steps to automate the process of building decision tree regression models:
1. Data Preparation: The first step is to prepare the data for the model. This includes cleaning the data, removing any outliers, and transforming the data into a format that can be used by the model.
2. Feature Selection: The next step is to select the features that will be used in the model. This can be done manually or with automated feature selection algorithms.
3. Model Building: Once the data is prepared and the features are selected, the model can be built. This can be done using a variety of algorithms, such as decision trees, random forests, and gradient boosting.
4. Model Evaluation: After the model is built, it should be evaluated to ensure that it is accurate and reliable. This can be done using a variety of metrics, such as accuracy, precision, recall, and F1 score.
5. Model Deployment: Finally, the model can be deployed in a production environment. This can be done using a variety of methods, such as web services, APIs, or batch processing.
By following these steps, the process of building decision tree regression models can be automated, saving time and resources while improving the accuracy of the results.
What are the Different Ensemble Methods for Decision Tree Regression?
Ensemble methods are a powerful tool for decision tree regression, as they combine multiple decision trees to create a more accurate and robust model. The following are some of the most commonly used ensemble methods for decision tree regression:
1. Bagging: Bagging, or bootstrap aggregating, is a technique that combines multiple decision trees by training each tree on a different subset of the data. This helps to reduce the variance of the model, as each tree is trained on a different set of data.
2. Boosting: Boosting is a technique that combines multiple decision trees by training each tree on the residuals of the previous tree. This helps to reduce the bias of the model, as each tree is trained on a different set of data.
3. Random Forest: Random forest is an ensemble method that combines multiple decision trees by randomly selecting a subset of features for each tree. This helps to reduce the variance of the model, as each tree is trained on a different set of features.
4. Gradient Boosting: Gradient boosting is an ensemble method that combines multiple decision trees by training each tree on the residuals of the previous tree. This helps to reduce the bias of the model, as each tree is trained on a different set of data.
5. Stacking: Stacking is an ensemble method that combines multiple decision trees by training each tree on the output of the previous tree. This helps to reduce the bias of the model, as each tree is trained on a different set of data.
How to Evaluate the Performance of Decision Tree Regression Models?
Decision tree regression models are powerful tools for predicting numerical values from a set of input variables. Evaluating the performance of these models is essential for ensuring that they are providing accurate and reliable predictions. There are several metrics that can be used to evaluate the performance of decision tree regression models.
The most commonly used metric is the coefficient of determination, also known as the R-squared value. This metric measures the amount of variance in the target variable that is explained by the model. A higher R-squared value indicates that the model is more accurate in predicting the target variable.
Another metric that can be used to evaluate the performance of decision tree regression models is the mean absolute error (MAE). This metric measures the average difference between the predicted values and the actual values. A lower MAE indicates that the model is more accurate in predicting the target variable.
The root mean squared error (RMSE) is another metric that can be used to evaluate the performance of decision tree regression models. This metric measures the average difference between the predicted values and the actual values, but it takes into account the magnitude of the errors. A lower RMSE indicates that the model is more accurate in predicting the target variable.
Finally, the mean absolute percentage error (MAPE) is a metric that can be used to evaluate the performance of decision tree regression models. This metric measures the average difference between the predicted values and the actual values, but it takes into account the percentage of errors. A lower MAPE indicates that the model is more accurate in predicting the target variable.
By using these metrics, it is possible to evaluate the performance of decision tree regression models and ensure that they are providing accurate and reliable predictions.
What are the Different Pruning Techniques for Decision Tree Regression?
Decision tree regression is a powerful machine learning technique used to predict continuous values. Pruning is an important technique used to improve the accuracy of decision tree regression models. Pruning helps to reduce the complexity of the model and avoid overfitting. There are several different pruning techniques for decision tree regression, including pre-pruning, post-pruning, and cost complexity pruning.
Pre-pruning is a technique used to reduce the size of the tree before it is built. This is done by setting a maximum depth for the tree or by setting a minimum number of samples required for a node to be split. Pre-pruning helps to reduce the complexity of the tree and avoid overfitting.
Post-pruning is a technique used to reduce the size of the tree after it has been built. This is done by removing branches from the tree that do not improve the accuracy of the model. Post-pruning helps to reduce the complexity of the tree and avoid overfitting.
Cost complexity pruning is a technique used to reduce the size of the tree by removing branches that do not improve the accuracy of the model. This is done by adding a penalty term to the cost function of the tree. The penalty term is used to penalize complex trees and encourage simpler trees. Cost complexity pruning helps to reduce the complexity of the tree and avoid overfitting.
These are the three main pruning techniques used for decision tree regression. Each technique has its own advantages and disadvantages, and it is important to choose the right technique for the specific problem. Pruning is an important technique used to improve the accuracy of decision tree regression models.
How to Visualize Decision Tree Regression Models?
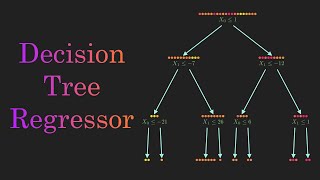
Decision tree regression models are powerful tools for predicting outcomes based on a set of input variables. Visualizing these models can help to better understand the relationships between the input variables and the output variable, as well as the overall structure of the model.
There are several ways to visualize decision tree regression models. The most common approach is to use a tree diagram, which shows the structure of the model in a hierarchical format. This diagram will show the root node, which is the starting point of the model, as well as the branches and leaves that represent the various decisions and outcomes. The diagram can also show the importance of each variable in the model, as well as the overall accuracy of the model.
Another way to visualize decision tree regression models is to use a feature importance plot. This plot shows the relative importance of each input variable in the model, which can help to identify which variables are most important for predicting the output variable.
Finally, decision tree regression models can also be visualized using a confusion matrix. This matrix shows the accuracy of the model in predicting the output variable, as well as the number of false positives and false negatives. This can help to identify areas where the model is not performing as well as it could be.
Visualizing decision tree regression models can be a powerful tool for understanding the structure and performance of the model. By using tree diagrams, feature importance plots, and confusion matrices, it is possible to gain a better understanding of the relationships between the input variables and the output variable, as well as the overall accuracy of the model.
What are the Best Practices for Building Decision Tree Regression Models?
1. Start by understanding the problem and the data set. Analyze the data set to identify the features that are most relevant to the problem.
2. Split the data set into training and testing sets. This will help to ensure that the model is not overfitted to the training data.
3. Choose an appropriate evaluation metric. This will help to ensure that the model is optimized for the desired outcome.
4. Use a grid search to find the optimal parameters for the model. This will help to ensure that the model is tuned for the best performance.
5. Use cross-validation to evaluate the model. This will help to ensure that the model is not overfitted to the training data.
6. Use pruning to reduce the complexity of the model. This will help to ensure that the model is not overfitted to the training data.
7. Monitor the performance of the model on the test set. This will help to ensure that the model is not overfitted to the training data.
8. Use ensemble methods to combine multiple decision tree models. This will help to improve the accuracy of the model.
How to Handle Missing Values in Decision Tree Regression?
Missing values can be a major challenge when it comes to decision tree regression. This is because decision tree regression is a supervised learning algorithm that requires all data points to be labeled. When a data point is missing, the algorithm cannot accurately predict the outcome.
Fortunately, there are several strategies that can be used to handle missing values in decision tree regression. The first is to simply ignore the missing values and continue with the analysis. This is a viable option if the missing values are few and far between. However, if the missing values are more frequent, this approach may not be suitable.
Another option is to impute the missing values. This involves replacing the missing values with estimates based on the existing data. This can be done using a variety of methods, such as mean imputation, median imputation, or k-nearest neighbor imputation.
Finally, it is also possible to use a decision tree algorithm that is designed to handle missing values. These algorithms are able to identify patterns in the data and make predictions even when some data points are missing.
No matter which approach is used, it is important to remember that decision tree regression is a powerful tool that can be used to make accurate predictions. With the right strategies, it is possible to handle missing values in decision tree regression and still achieve reliable results.
What are the Different Types of Decision Tree Regression?
Decision tree regression is a supervised learning algorithm that is used to predict continuous values. It is a type of regression analysis that uses a decision tree as a predictive model to predict the value of a target variable. There are several types of decision tree regression, including:
1. Classification and Regression Trees (CART): CART is a type of decision tree regression that is used to predict a categorical response variable. It is a non-parametric method that uses a tree-like structure to model the relationship between the independent and dependent variables.
2. Chi-Square Automatic Interaction Detection (CHAID): CHAID is a type of decision tree regression that is used to identify interactions between independent variables and the dependent variable. It is a non-parametric method that uses a tree-like structure to model the relationship between the independent and dependent variables.
3. Iterative Dichotomiser 3 (ID3): ID3 is a type of decision tree regression that is used to predict a categorical response variable. It is a non-parametric method that uses a tree-like structure to model the relationship between the independent and dependent variables.
4. C4.5: C4.5 is a type of decision tree regression that is used to predict a categorical response variable. It is a non-parametric method that uses a tree-like structure to model the relationship between the independent and dependent variables.
5. Random Forest: Random forest is a type of decision tree regression that is used to predict a continuous response variable. It is an ensemble method that uses multiple decision trees to make predictions.
6. Gradient Boosting: Gradient boosting is a type of decision tree regression that is used to predict a continuous response variable. It is an ensemble method that uses multiple decision trees to make predictions.
How to Avoid Overfitting in Decision Tree Regression?
Overfitting in decision tree regression is a common problem that can occur when the model is too complex and is not able to generalize well to unseen data. To avoid overfitting, there are several techniques that can be used.
First, it is important to use a validation set to evaluate the performance of the model. This will help to identify any potential overfitting issues before the model is deployed.
Second, pruning techniques can be used to reduce the complexity of the model. Pruning involves removing branches from the tree that do not contribute to the accuracy of the model. This can help to reduce the complexity of the model and reduce the risk of overfitting.
Third, regularization techniques can be used to reduce the complexity of the model. Regularization involves adding a penalty to the model for having too many parameters. This can help to reduce the complexity of the model and reduce the risk of overfitting.
Finally, it is important to use cross-validation to evaluate the performance of the model. Cross-validation involves splitting the data into multiple sets and training the model on each set. This can help to identify any potential overfitting issues before the model is deployed.
By using these techniques, it is possible to reduce the risk of overfitting in decision tree regression.
How to Choose the Best Splitting Criterion for Decision Tree Regression?
When building a decision tree for regression, it is important to choose the best splitting criterion to ensure the most accurate predictions. The splitting criterion is the measure used to determine the best split of the data at each node of the tree. The most commonly used splitting criteria for decision tree regression are the mean squared error (MSE), the mean absolute error (MAE), and the Gini index.
The mean squared error (MSE) is the most commonly used splitting criterion for decision tree regression. It is calculated by taking the average of the squared differences between the predicted and actual values. The MSE is a measure of the variance of the errors and is used to minimize the sum of the squared errors.
The mean absolute error (MAE) is another popular splitting criterion for decision tree regression. It is calculated by taking the average of the absolute differences between the predicted and actual values. The MAE is a measure of the average magnitude of the errors and is used to minimize the sum of the absolute errors.
The Gini index is a measure of the impurity of the data at each node of the tree. It is calculated by taking the sum of the squared probabilities of each class in the node. The Gini index is used to maximize the purity of the data at each node.
When choosing the best splitting criterion for decision tree regression, it is important to consider the type of data being used and the desired accuracy of the predictions. The MSE and MAE are both suitable for most types of data and are used to minimize the errors. The Gini index is best used for categorical data and is used to maximize the purity of the data.
What are the Limitations of Decision Tree Regression?
Decision tree regression is a powerful tool for predictive modeling, but it has some limitations. Firstly, decision tree regression is prone to overfitting, which means that the model may fit the training data too closely and not generalize well to unseen data. This can lead to poor performance on unseen data. Secondly, decision tree regression is sensitive to small changes in the data, which can lead to large changes in the structure of the tree. This can make the model difficult to interpret and can lead to instability in the model. Finally, decision tree regression is not suitable for continuous data, as it is designed to work with categorical data.
What are the Benefits of Decision Tree Regression?
Decision tree regression is a powerful machine learning technique that can be used to predict continuous values. It is a supervised learning algorithm that can be used to both classify and regress data. Decision tree regression has several advantages over other regression techniques.
First, decision tree regression is easy to interpret and explain. The model is represented as a tree-like structure, which makes it easy to understand the relationships between the input variables and the output variable. This makes decision tree regression a great choice for applications where interpretability is important.
Second, decision tree regression is robust to outliers. Outliers are data points that are far away from the majority of the data points. Decision tree regression is able to identify and ignore outliers, which makes it more accurate than other regression techniques.
Third, decision tree regression is able to handle non-linear relationships between the input variables and the output variable. This makes it a great choice for applications where the data is not linearly separable.
Finally, decision tree regression is able to handle large datasets with high dimensionality. This makes it a great choice for applications where the data is complex and has many features.
Overall, decision tree regression is a powerful machine learning technique that has several advantages over other regression techniques. It is easy to interpret, robust to outliers, able to handle non-linear relationships, and able to handle large datasets with high dimensionality.
How to Interpret the Results of Decision Tree Regression?
Decision tree regression is a powerful machine learning technique used to predict continuous values. It is a supervised learning algorithm that uses a tree-like structure to model the relationships between the input variables and the output variable. The results of decision tree regression can be interpreted in several ways.
First, the tree structure can be used to identify the most important input variables that are influencing the output variable. The tree structure can also be used to identify the interactions between the input variables and the output variable. This can help to identify which combinations of input variables are most important for predicting the output variable.
Second, the tree structure can be used to identify the most important splits in the data. This can help to identify which values of the input variables are most important for predicting the output variable.
Third, the tree structure can be used to identify the most important thresholds for the input variables. This can help to identify which values of the input variables are most important for predicting the output variable.
Finally, the tree structure can be used to identify the most important rules for predicting the output variable. This can help to identify which combinations of input variables are most important for predicting the output variable.
By interpreting the results of decision tree regression, it is possible to gain insight into the relationships between the input variables and the output variable. This can help to improve the accuracy of the predictions made by the model.
What is Decision Tree Regression and How Does it Work?
Decision tree regression is a supervised machine learning algorithm that is used to predict continuous values. It is a type of regression analysis that uses a decision tree as a predictive model to predict the value of a target variable by learning simple decision rules inferred from the data features.
The decision tree works by splitting the data into smaller and smaller subsets while at the same time an associated decision tree is incrementally developed. The final result is a tree with decision nodes and leaf nodes. The decision nodes are used to determine the value of the target variable, while the leaf nodes represent the decision made after computing all the conditions in the decision nodes.
The decision tree is built by using an algorithm that recursively splits the data into subsets based on the most significant independent variable. The algorithm then selects the best split point based on a cost function, such as the Gini index or the information gain. The split point is chosen so that the resulting subsets are as homogeneous as possible.
Once the decision tree is built, it can be used to make predictions. The prediction is made by traversing the tree from the root node to a leaf node. The value of the target variable is determined by the leaf node that is reached.
Conclusion
Decision Tree Regression is an intuitive approach for machine learning beginners. It is a powerful tool for predicting continuous values and can be used to solve a variety of problems. It is easy to understand and interpret, and can be used to identify important features in a dataset. Decision Tree Regression is a great starting point for machine learning beginners, as it provides a simple and straightforward way to build models and make predictions.
:quality(70):focal(721x266:731x276)/cloudfront-eu-central-1.images.arcpublishing.com/irishtimes/7CD6DUVAXMHMN3OJCCZNALGVIU.jpg?resize=1200,630&ssl=1)